At A Glance
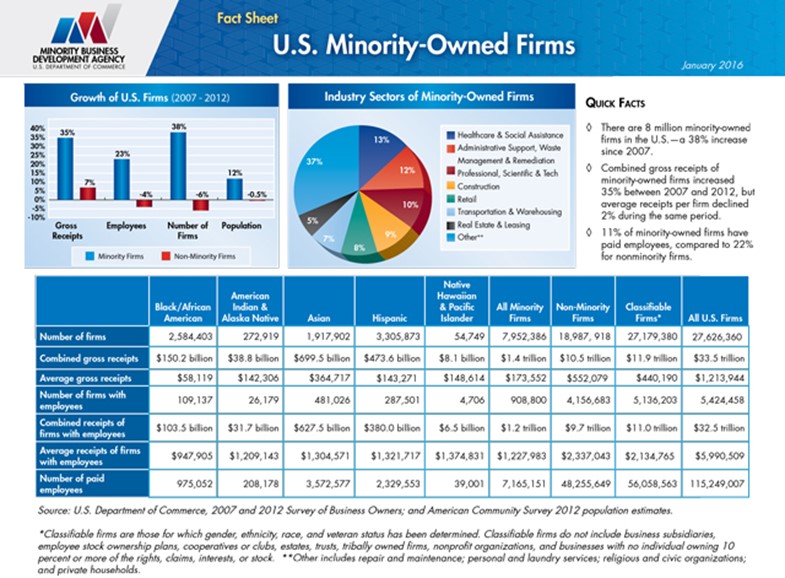
According to the Census Bureau’s latest Annual Survey of Entrepreneurs (2016), there are 1,054,575 minority-owned businesses with employees in the United States. Overall, 20 percent of all employer businesses were at least 51 percent owned by minority entrepreneurs, employing 8.7 million workers at a total annual payroll of $280 billion and amassing $1.3 trillion in total annual receipts. On average, a minority-owned firm had $1.2 million in annual sales and employed eight workers. Small businesses constitute the majority of these firms with 99.9 percent of minority-owned employer businesses having fewer than 500 employees.
The Minority Business Owner
From 2014 to 2016, the overall number of minority-owned employer businesses rose 11percent, while the non-minority figure rose 1 percent. Chart 1 shows the percent changein the number of employer businesses owned by different minority groups with Hispanic-owned businesses leading in 13 percent growth. In 2016 there were 555,000 employer businesses with an Asian owner, the highest number of any minority category. Out of all racial and ethnic groups, Black or African American-owned employer firms had the greatest share of female owners, at 39 percent. American Indian and Alaska Native employer firms had the highest share of veteran-owners across all racial and ethnic groups, at 13 percent. Native Hawaiian and Other Pacific Islander firms had the youngest owners, as 12 percent of employer firm owners were under the age of 35.
Industry and Geographic Diversity
Minority-owned businesses are active in a wide range of sectors and areas. In 2016, the industries with the largest number of workers employed by a minority-owned businesswere the accommodation and food services with 2.4 million employees, health care and social assistance with 1.4 million employees, and retail trade with 863,000 employees. Chart 2 shows the percentage of businesses owned by minority entrepreneurs in each state. States with the highest share of minority-owned businesses were Hawaii with 61 percent, California with 36 percent, Texas with 30 percent, and New Mexico with 27percent.
